colleyRstats helps streamline a typical analysis
workflow: configure a session, check assumptions, create a plot, and
generate manuscript-ready text.
Session setup
Attach the packages you need first, then configure the session.
colleyRstats_setup() sets the package’s
ggplot2 theme, so every figure below comes out with
consistent typography.
library(colleyRstats)
#> Loading required package: ggplot2
#> Registered S3 methods overwritten by 'ggpp':
#>   method                  from
#>   heightDetails.titleGrob ggplot2
#>   widthDetails.titleGrob  ggplot2

colleyRstats_setup(print_citation = FALSE, verbose = FALSE)
If you also want the package’s conflicted preferences –
dplyr::filter() over stats::filter(),
psych::describe() over Hmisc::describe(), and
so on – pass set_conflicts = TRUE, and put that call
after every library() call in the
script:
library(colleyRstats)
library(easystats)
library(dplyr)

colleyRstats_setup(set_conflicts = TRUE)   # last
The ordering matters in both directions. Activating
conflicted replaces library() for the rest of
the session, and meta-packages such as easystats cannot be
attached once it has; and conflicted resolves only those
names that are ambiguous among the packages attached at the time, so a
call made before the rest of your library() calls has less
to work with.
Check assumptions
check_normality_by_group(main_df, "ConditionID", "score")
#> [1] TRUE
#> attr(,"tests")
#>   ConditionID         W   p_value
#> 1     Control 0.9378270 0.2180765
#> 2   Treatment 0.9667112 0.6844808
check_homogeneity_by_group(main_df, "ConditionID", "score")
#> [1] TRUE
#> attr(,"test")
#>   df1 df2 statistic         p
#> 1   1  38 0.1081505 0.7440653
Create a plot
plot_effect(
  data = transform(main_df, Group = ConditionID),
  x = "ConditionID",
  y = "score",
  fillColourGroup = "Group",
  ytext = "Score",
  xtext = "Condition"
)
#> `geom_line()`: Each group consists of only one observation.
#> ℹ Do you need to adjust the group aesthetic?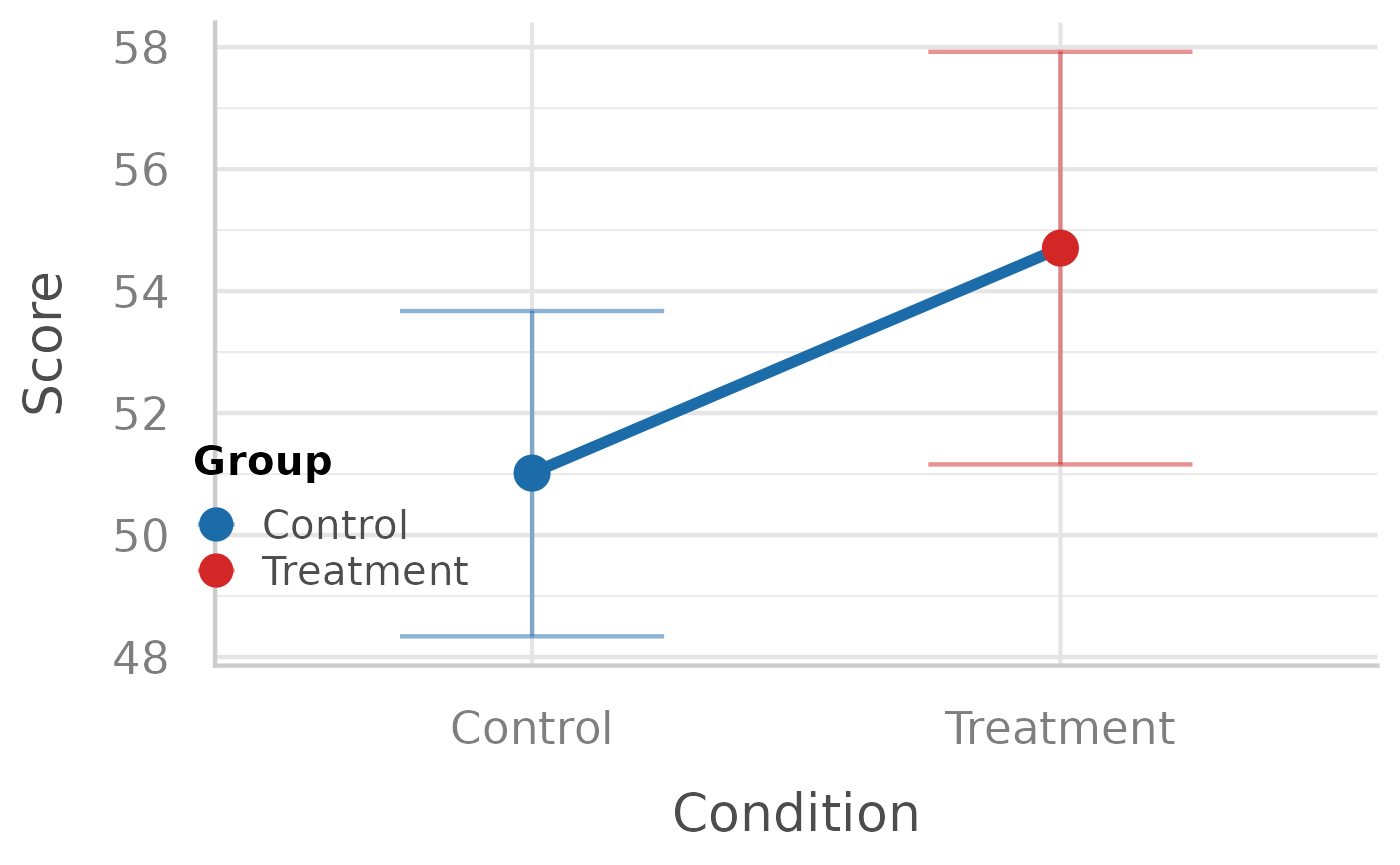
Produce a reporting sentence
art_summary <- data.frame(
  Effect = "ConditionID",
  Df = 1,
  `F value` = 5.42,
  `Pr(>F)` = 0.027,
  Df.res = 19,
  check.names = FALSE
)

report_art(art_summary, dv = "score")
#> The ART found a significant main effect of \ConditionID on score (\F{1}{19}{5.42}, \p{0.027}, $\eta_{p}^{2}$ = 0.22, 95\% CI: [0.01, 1.00]).
Next steps
-
vignette("analyzing-a-user-study")walks a complete within-subjects study from raw data to manuscript-ready text and figures, including the one-callanalyze_and_report()/report_all()pipeline. -
vignette("choosing-a-test")shows howrecommend_test()selects the right test or mixed model from the data, and how to report GLMMs/CLMMs. -
vignette("overleaf")covers getting the LaTeX output into an Overleaf project that compiles immediately (latex_preamble(),use_colleyrstats_sty(),emit_overleaf()). - Browse the reference for reporting helpers such as
reportMeanAndSD()andreportDunnTest(), and usegenerateMoboPlot()/generateMoboPlot2()for optimization studies.