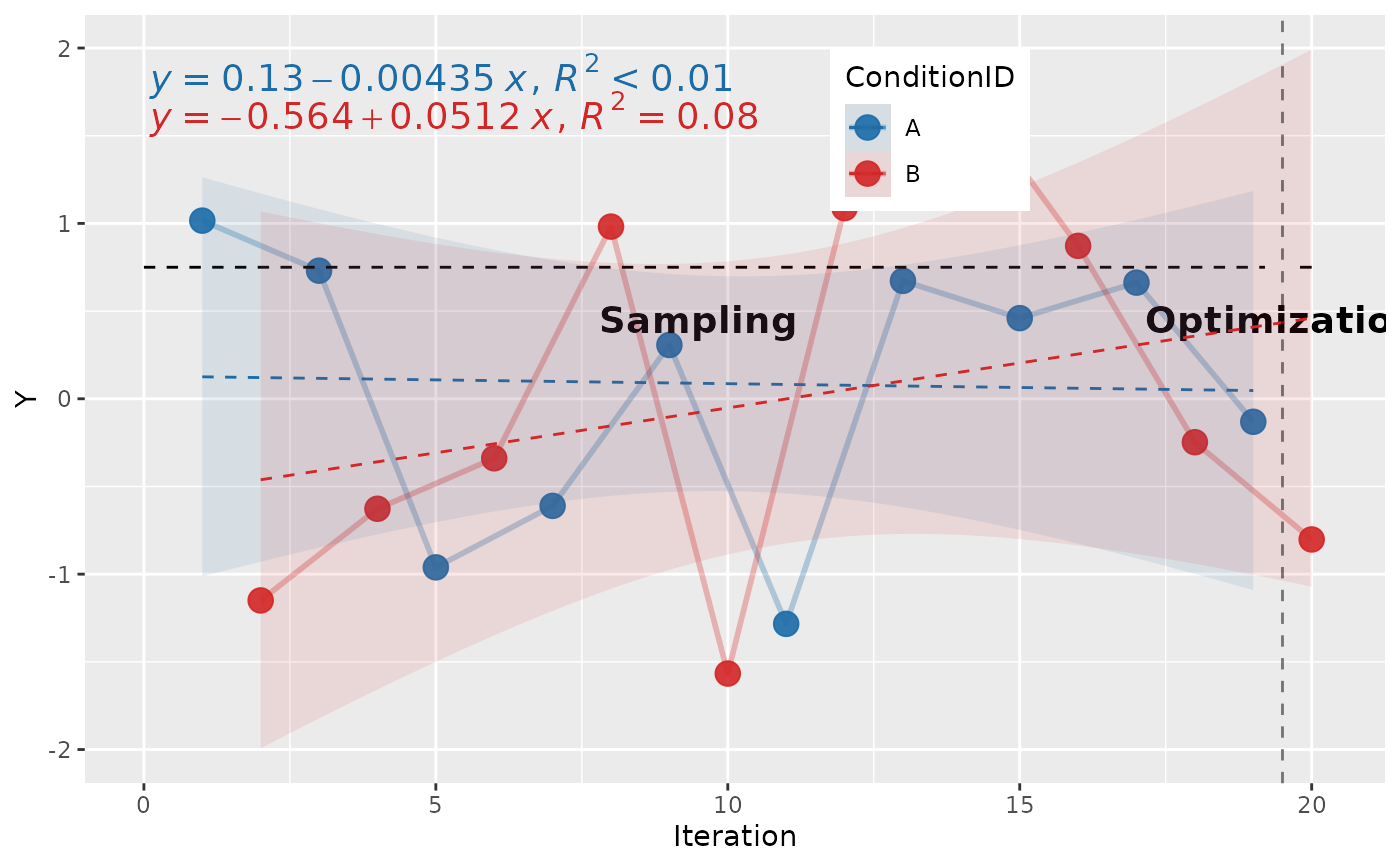
Generate a Multi-objective Optimization Plot
Source:R/plotting.R, R/zzz-aliases.R
generateMoboPlot2.RdThis function generates a multi-objective optimization plot using ggplot2. The plot visualizes the relationship between the x and y variables, grouping and coloring by a fill variable, with the option to customize legend position, labels, and annotation of sampling and optimization phases.
Appropriate if you use https://github.com/Pascal-Jansen/Bayesian-Optimization-for-Unity in version 1.1.0 or higher.
Usage
generateMoboPlot2(
  data,
  x = "Iteration",
  y,
  phaseCol = "Phase",
  fillColourGroup = "ConditionID",
  ytext,
  legendPos = c(0.65, 0.85),
  labelPosFormulaY = "top",
  labelPosFormulaX = "left",
  horizontalLinePosY = 0.75,
  horizontalLineDistToText = 0.3,
  fillLabels = NULL,
  annotationTextSize = 5
)

plot_mobo2(
  data,
  x = "Iteration",
  y,
  phaseCol = "Phase",
  fillColourGroup = "ConditionID",
  ytext,
  legendPos = c(0.65, 0.85),
  labelPosFormulaY = "top",
  labelPosFormulaX = "left",
  horizontalLinePosY = 0.75,
  horizontalLineDistToText = 0.3,
  fillLabels = NULL,
  annotationTextSize = 5
)
Arguments
- data
A data frame containing the data to be plotted.
- x
A string representing the column name in
datato be used for the x-axis. Can be either numeric or factor. Default is"Iteration".- y
A string representing the column name in
datato be used for the y-axis. This should be a numeric variable.- phaseCol
the name of the column for the color of the phase (sampling or optimization)
- fillColourGroup
A string representing the column name in
datathat defines the fill color grouping for the plot. Default is"ConditionID".- ytext
A custom label for the y-axis. If not provided, the y-axis label will be the title-cased version of
y.- legendPos
A numeric vector of length 2 specifying the position of the legend inside the plot. Default is
c(0.65, 0.85).- labelPosFormulaY
A string specifying the vertical position of the polynomial equation label in the plot. Acceptable values are
"top","center", or"bottom". Default is"top".- labelPosFormulaX
A string specifying the position of the polynomial equation label in the plot. Acceptable values are
"left","center", or"right". Default is"left".- horizontalLinePosY
A numeric value of the y-coordinate where the "sampling" and "optimization" line should be drawn. Default is
0.75- horizontalLineDistToText
A numeric value of the y-coordinate where the "sampling" and "optimization" text should be drawn below the line. Default is
0.3- fillLabels
An optional named character vector mapping raw factor levels to display labels for the fill/colour legend (e.g.
c("value_only" = "Value Only", "llm_only" = "LLM Only")). IfNULL(default), the original factor levels are used as-is.- annotationTextSize
numeric. The font size for embedded text annotations inside the plot (e.g., "Sampling", "Optimization" labels, and the regression equations). Default is
5.0.
Naming
plot_mobo2() is the spelling used throughout the documentation and
the one to prefer in new code: the report_* / plot_* / check_* prefixes
make the API discoverable through autocomplete.
generateMoboPlot2() ![[Superseded]](figures/lifecycle-superseded.svg) is the original
name. Both names refer to the same function object, so they are entirely
interchangeable; the original remains fully supported and is not scheduled
for removal, and existing scripts keep working unchanged.
is the original
name. Both names refer to the same function object, so they are entirely
interchangeable; the original remains fully supported and is not scheduled
for removal, and existing scripts keep working unchanged.