Check the data's distribution. If non-normal, take the non-parametric variant of ggbetweenstats. x and y have to be in parentheses, e.g., "ConditionID".
Source:R/plotting.R, R/zzz-aliases.R
ggbetweenstatsWithPriorNormalityCheck.RdCheck the data's distribution. If non-normal, take the non-parametric variant of ggbetweenstats. x and y have to be in parentheses, e.g., "ConditionID".
Usage
ggbetweenstatsWithPriorNormalityCheck(
  data,
  x,
  y,
  ylab,
  xlabels = NULL,
  showPairwiseComp = TRUE,
  plotType = "boxviolin"
)

plot_between_stats(
  data,
  x,
  y,
  ylab,
  xlabels = NULL,
  showPairwiseComp = TRUE,
  plotType = "boxviolin"
)
Arguments
- data
the data frame
- x
the independent variable, most likely "ConditionID"
- y
the dependent variable under investigation
- ylab
label to be shown for the dependent variable
- xlabels
labels to be used for the x-axis
- showPairwiseComp
whether to show pairwise comparisons, TRUE as default
- plotType
either "box", "violin", or "boxviolin" (default)
Value
A ggplot object produced by ggstatsplot::ggbetweenstats, which can be printed or further modified with +.
Naming
plot_between_stats() is the spelling used throughout the documentation and
the one to prefer in new code: the report_* / plot_* / check_* prefixes
make the API discoverable through autocomplete.
ggbetweenstatsWithPriorNormalityCheck() ![[Superseded]](figures/lifecycle-superseded.svg) is the original
name. Both names refer to the same function object, so they are entirely
interchangeable; the original remains fully supported and is not scheduled
for removal, and existing scripts keep working unchanged.
is the original
name. Both names refer to the same function object, so they are entirely
interchangeable; the original remains fully supported and is not scheduled
for removal, and existing scripts keep working unchanged.
Examples
# \donttest{
set.seed(123)
# Toy within-subject style data
main_df <- data.frame(
Participant = factor(rep(1:20, each = 3)),
CondID = factor(rep(c("A", "B", "C"), times = 20)),
tlx_mental = rnorm(60, mean = 50, sd = 10)
)
# Custom x-axis labels
labels_xlab <- c("Condition A", "Condition B", "Condition C")
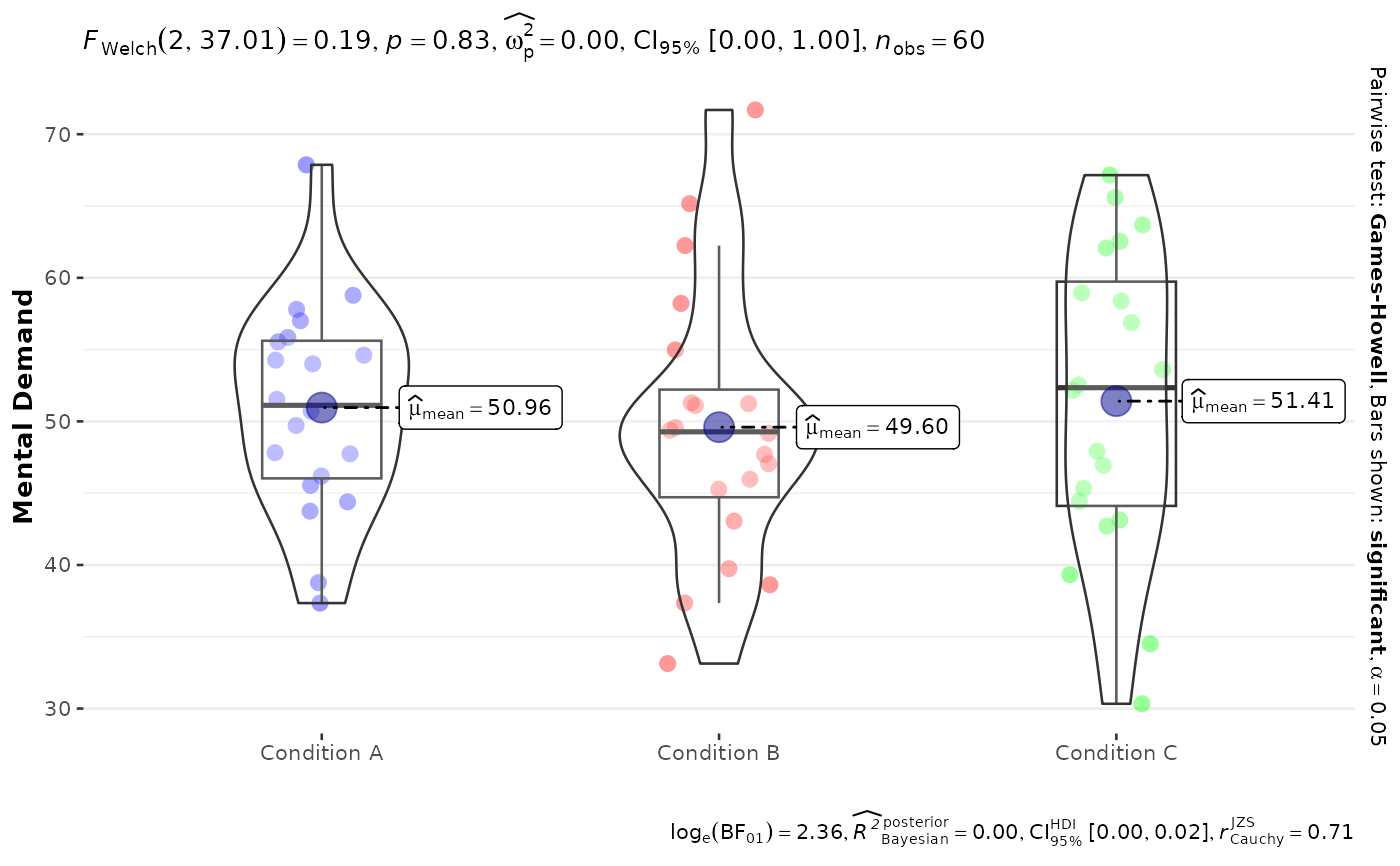
ggbetweenstatsWithPriorNormalityCheck(
data = main_df,
x = "CondID",
y = "tlx_mental", ylab = "Mental Demand",
xlabels = labels_xlab,
showPairwiseComp = TRUE
)
#> Scale for x is already present.
#> Adding another scale for x, which will replace the existing scale.
 # }
# }